by Laura Andrea Acosta Figueredo, YFEL 2020 Member
The average crude oil production for the year 2018 in Colombia, until August was 858 KBPD (Thousand Barrels Per Day) [1], of which for each barrel of crude produced, 11.6 barrels of water on average [2]. These contain phenolic compounds between 98 and 128 mg/L [3], very high values compared to the maximum permissible limits required by Resolution 0631 of 2015 in Colombia, reported as 0.20 mg/L [4]. It represents a serious discharge problem due to its low biodegradability, high toxicity, as well as causing considerable damage to Ecosystems and human health.
The Fenton process with ultraviolet light, different concentrations of Fe2+ and H2O2 has proven highly effective and is positioned as an economically viable alternative for the elimination of toxic and persistent pollutants. Allows the oxidation of phenol in the best case to CO2 and H2O [5].
The use of solid waste as a catalyst is proposed, such as fly ash, whose estimated total annual global generation is 7.5 x 10³ t/year. It has a very attractive chemical composition to be used in the Photo-Fenton process due to the presence of iron oxide and TiO2 in the structure [6].
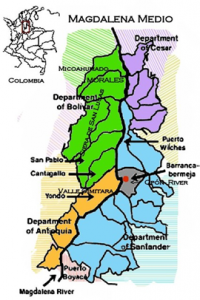
Image 2. Magdalena Valley

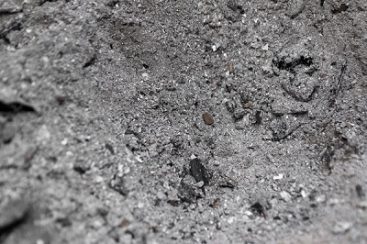
Image 2. Fly ash
The characterization of fly ash from the waste of Termotasajero S.A. thermoelectric was carried out, for which X-ray fluorescence (XRF), X-ray diffraction (XRD), molecular adsorption (BET) and morphology tests were performed.
The variables of fly ash and peroxide concentration were taken as variables (Table 1). Two targets were made to check the effect of ash and peroxide in the presence of LED light on a concentration of 50 ppm of phenol, finding the degradation percentages are not significant in any of the cases. Then, several of the 4 of the 9 tests proposed at 30 ° C and with a pH of 3 were carried out.
|
Variable |
Units |
Range |
||
|
C,H2O2 |
mM |
5 |
12,5 |
20 |
|
C,Fly ash |
g/L |
0,2 |
0,6 |
1,0 |
Table 1. Ranges of the variables proposed
To monitor the degradation, the 4-aminoantipyrine colorimetric method was used, from which a colored reaction is generated and the absorbance of the samples with respect to time was taken.
100% degradation of the phenol concentration of a 50-ppm solution was achieved in 140 minutes, from the addition of 12.5 mM H2O2 and 5.55 g/L of fly ash.
MATERIALS AND METHODS
![]()
RESULTS AND DISCUSSION
Fly Ash characterization
The smallest diameter was 0.54 μm and the largest was 67.85 μm, with a standard deviation of 3.09 μm, showing that its distribution is heterogeneous. The particles are predominantly spherical in shape (left) and consist of solid spheres and porous unburned carbon (right).
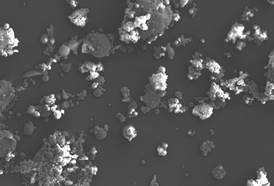

Image 3. SEM (left) and TEM (right) micrographs of fly ash from Termotasajero
This suggests that once the ash is involved in the catalytic photo process, the Photo-Fenton process prevails over heterogeneous photocatalysis by titanium dioxide
|
Chemical Composition (% w/w) |
|||||||||||
|
SiO2 |
TiO2 |
Al2O3 |
Fe2O3 |
MnO |
MgO |
CaO |
Na2O |
K2O |
P2O5 |
SO3 |
BaO |
|
51.49 |
1.08 |
26.37 |
9.37 |
N.D. |
0.32 |
0.63 |
N.D. |
1.05 |
0.13 |
0.30 |
0.14 |
Table 2. Chemical Composition (% w/w) of Fly Ash from Termotasajero S.A
The X-ray diffraction pattern (XRD) for the ash sample revealed the presence of the mineralogical phases: Mullite (31,5%), Quartz (9,7%), Magnetite (2,3%), Amorphous (55,8%).
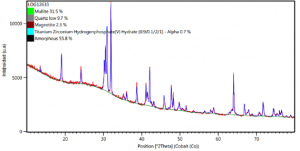
Image 4. X-ray diffraction pattern (XRD) of fly ash from Termotasajero S.A.
Phenol Degradation
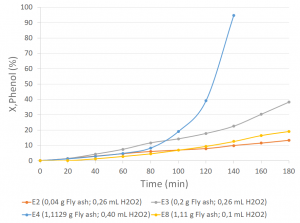
Graph 1. X,Phenol (%) vs. time (min)
Future Work
REFERENCES